2. 用TPU分类100种花
2. 用TPU分类100种花
本文是 Flower Classification with TPUs比赛中一个使用VGG16预训练模型在TPU上的实现 Getting started with 100+ flowers on TPU 。也可以在 Colab 查看.
首先是一些参数设置,主要是设置TPU。
1 | import math, re, os |
1. 可视化工具
- 将
batch data变换为images和labels的numpy格式,并且对于后面使用的test data这种没有label的数据,将label置为None
1 | np.set_printoptions(threshold=15, linewidth=80)#threshold 列数阈值 |
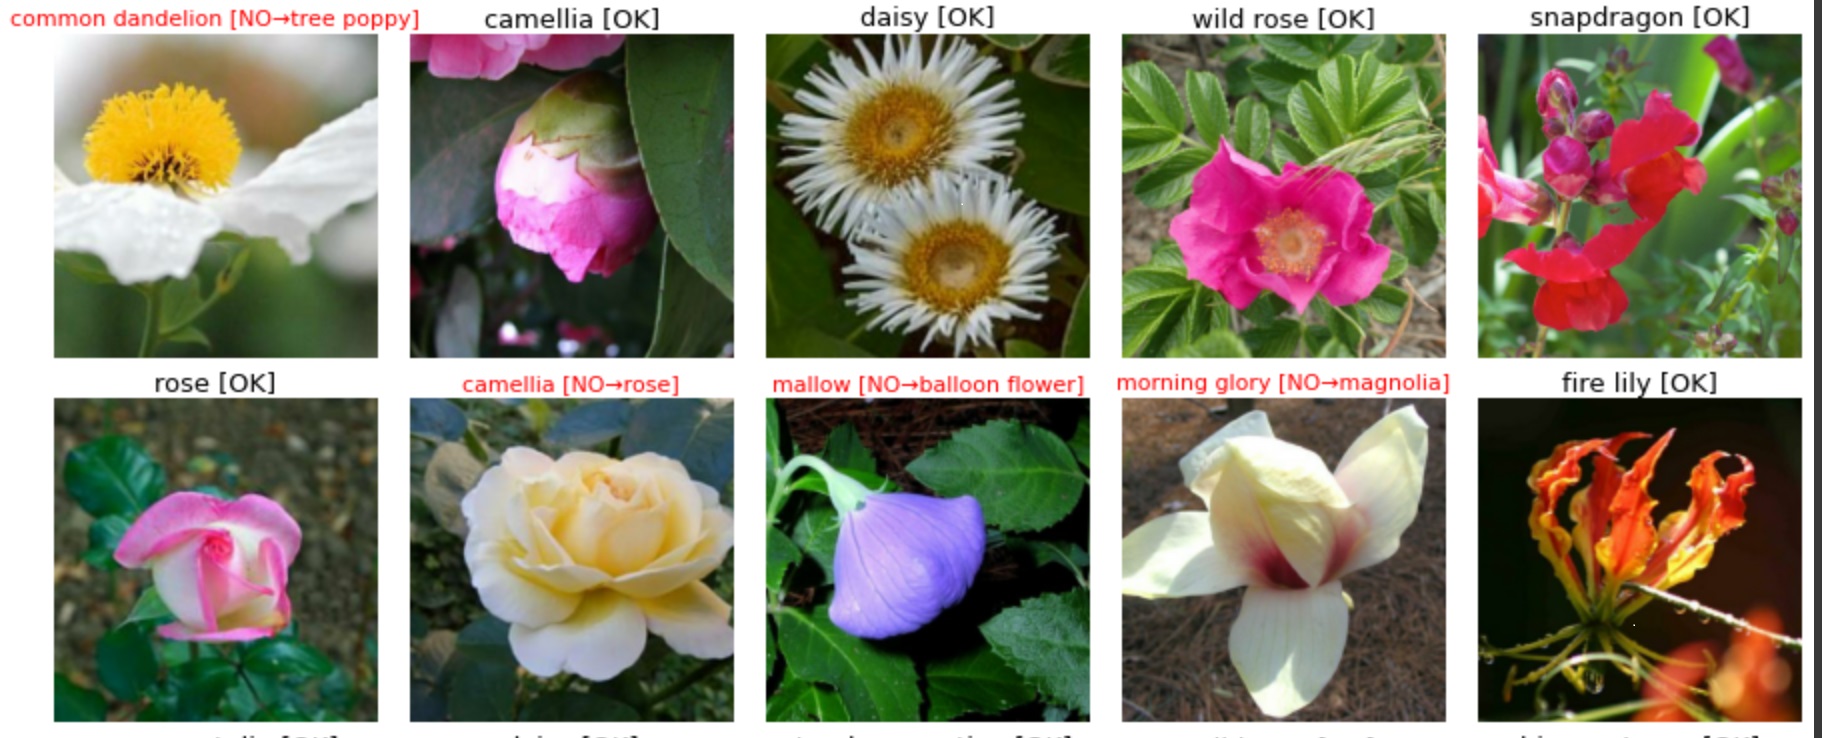
- 对于预测得到的
label和correct label,如果一样就标识为OK,不一样就表示NO;再加符号,以及正确的花名。实际上,就是给定格式:
预测的花名 [OK/NO 符号/ 正确的花名/ ]。如,
1 | def title_from_label_and_target(label, correct_label): |
- 按照标题展示每张花的图片,如果不正确就用红色,正确就用黑色。并将子图中最后一位代表绘制第几张图的变量加1.
1 | def display_one_flower(image, title, subplot, red=False, titlesize=16): |
这个函数使用多次,会用于
training dataset/test dataset可视化,以及预测结果可视化。将batch data转为numpy格式,如果没有label就将labels赋值为None
通过rows, cols来调整figure, rows是绘制图的行数, 通过一个batch中images的张数的开方来确定,本意是绘制出子图构成2x2这种方形的大图。而cols通过整个images数目//rows得到。
这时,我们要看rows和cols哪个大,两者对应着整个大图的长和宽,哪个大就将长或宽分割成
FIGSIZE / cols * rows份给每个子图添加标题信息
展示每张花

1 | def display_batch_of_images(databatch, predictions=None): |
- 展示混淆矩阵:
- 绘制混淆矩阵,并设置x,y刻度值和形式
- 加上有关score, precision, recall 文本
1 | def display_confusion_matrix(cmat, score, precision, recall): |
- 绘制训练指标曲线
1 | def display_training_curves(training, validation, title, subplot): |
2. 创建数据集
1 | def decode_image(image_data): |
利用 count_data_items(filenames),看看每个数据集大小。
1 | NUM_TRAINING_IMAGES = count_data_items(TRAINING_FILENAMES) #训练集图片数目 |
3. 数据集可视化
1 | print("Training data shapes:") |
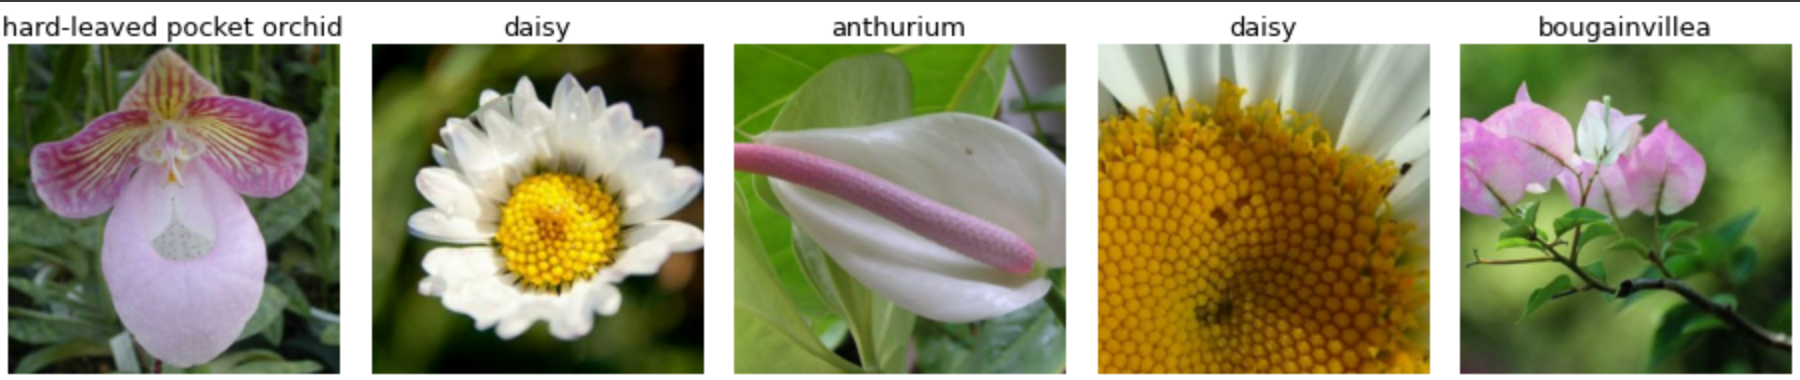
训练数据展示:
1 | training_dataset = get_training_dataset() |
总共20张,只展示5张。
1 | test_dataset = get_test_dataset() |
4. 建立模型和训练
1 | with strategy.scope(): |
看看模型参数:
1 | model.compile(optimizer='adam', |
训练:
1 | history = model.fit(get_training_dataset(), steps_per_epoch=STEP_PER_EPOCH, epochs=EPOCHS,\ |
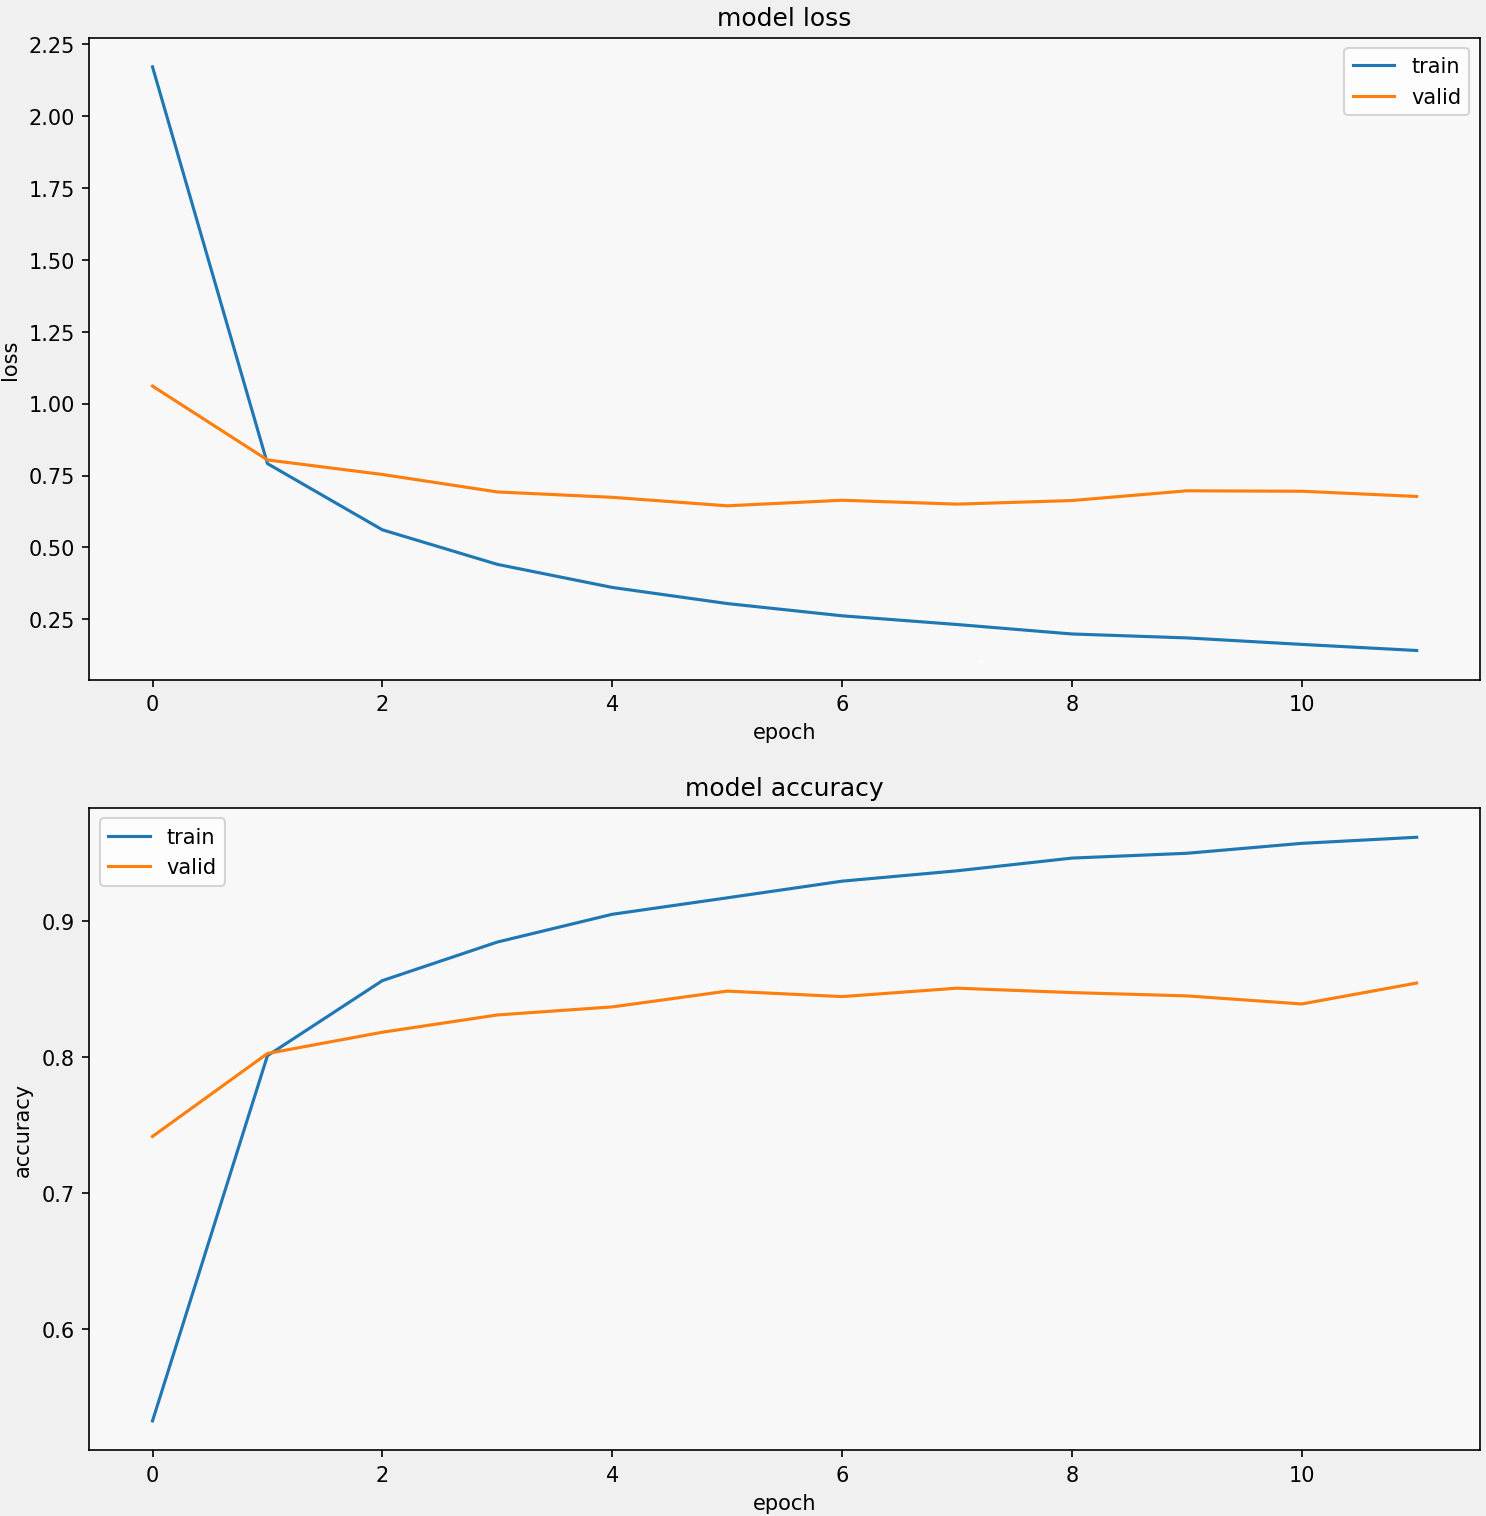
绘制训练曲线:
1 | display_training_curves(history.history['loss'], history.history['val_loss'], 'loss', 211) |
5.混淆矩阵
1 | #因为对数据集进行了分割,分开迭代images和labels,保证顺序才能保证两者是一对 |
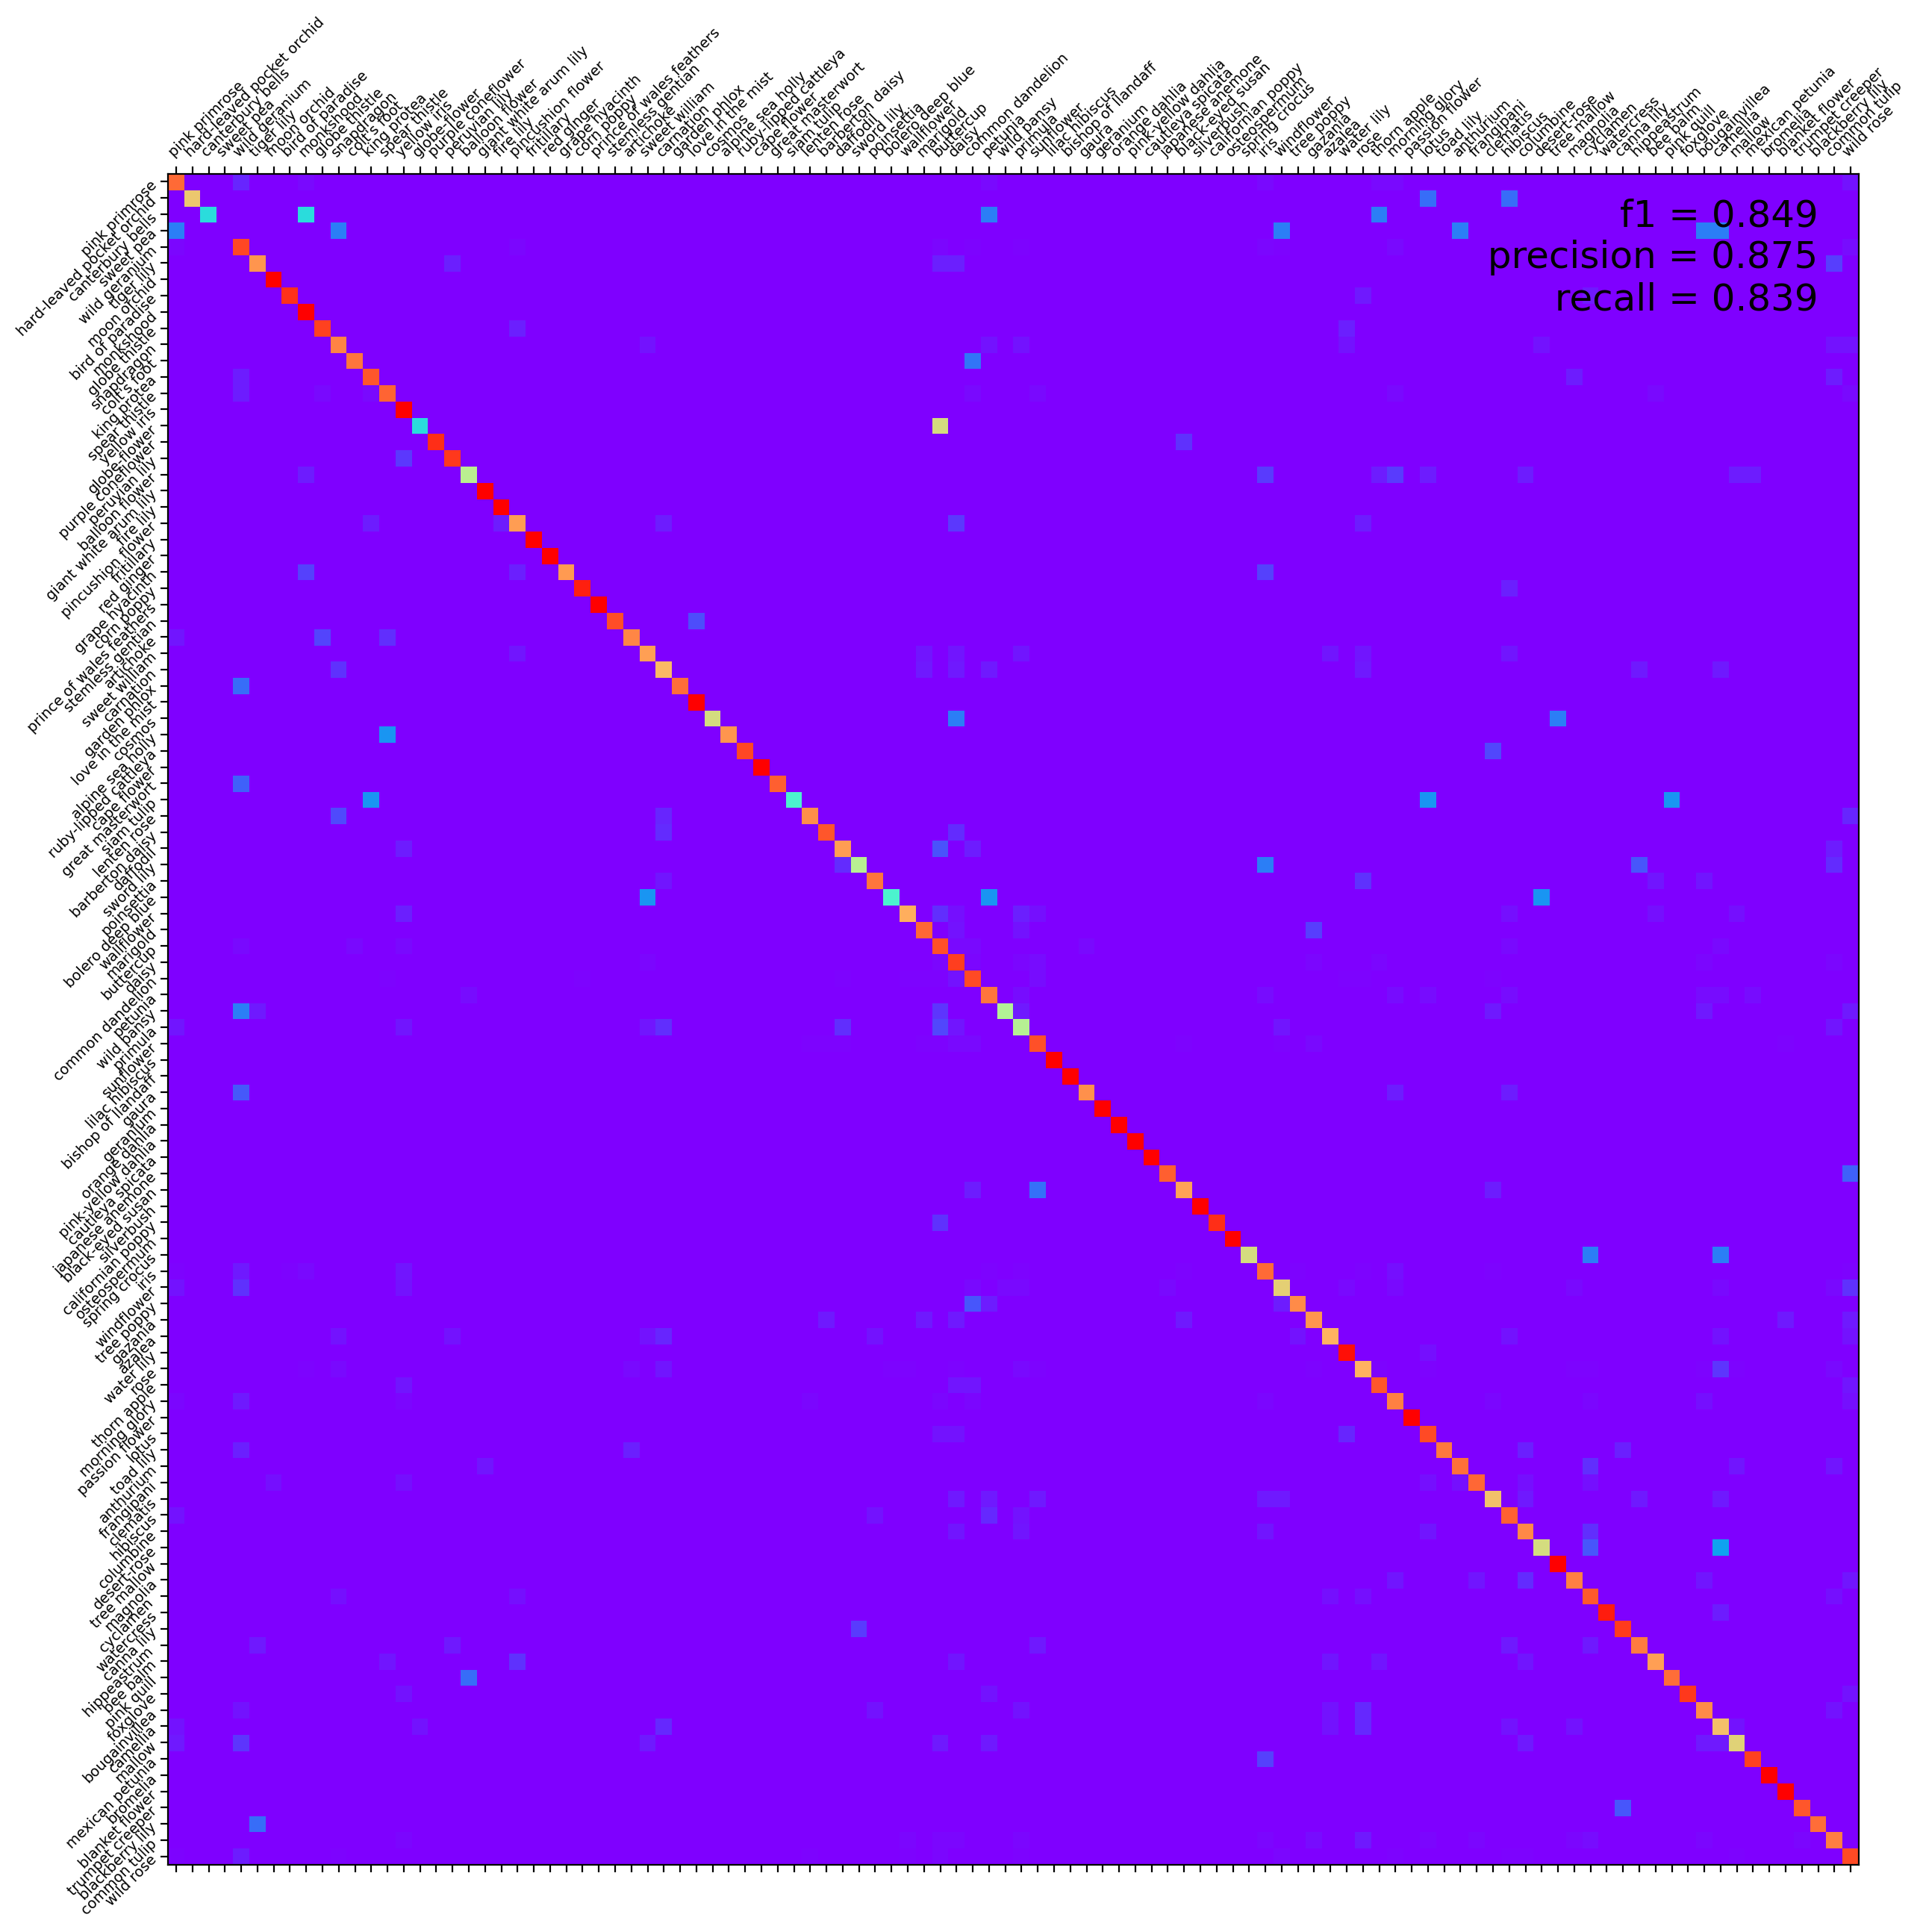
图示混淆矩阵:1
2
3
4
5
6
7
8
9
10
11
12
13
14confusion_mat = confusion_matrix(confusion_correct_labels,\
confusion_predictions, labels=range(len(CLASSES)))
score = f1_score(confusion_correct_labels, confusion_predictions,\
labels=range(len(CLASSES)), average='macro')
precision = precision_score(confusion_correct_labels,\
confusion_predictions, labels=range(len(CLASSES)), average='macro')
recall = recall_score(confusion_correct_labels,\
confusion_predictions, labels=range(len(CLASSES)), average='macro')
cmat = (confusion_mat.T / confusion_mat.sum(axis=1)).T
display_confusion_matrix(cmat, score, precision, recall)
print('f1 score:{:.3f}, precision: {:.3f}, recall: {:.3f}'\
.format(score, precision, recall))
===================================================
f1 score:0.849, precision: 0.875, recall: 0.839
6. 预测
1 | test_ds = get_test_dataset(ordered=True) |
保存csv结果。
1 | #生成csv |
可视化结果:
1 | ## 可视化结果 |
 wechat
 alipay